How long can you avoid the Regression Monster?
Florida, UConn, and how we treat acts of extreme resistance to the mean
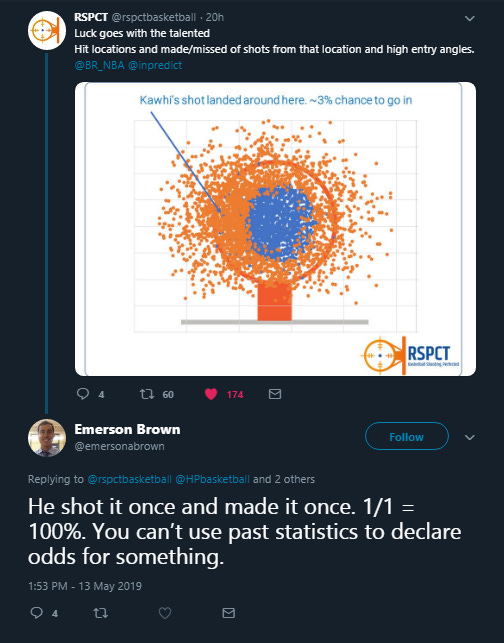
There is a post I think about a lot. It is from the before times, aka pre-COVID, after Kawhi Leonard made The Shot. The original post is long gone, and I had to dig through a couple different Twitter searches to find it among previous posts of my own. But it is this.
It feels like a primeval version of the average person’s revulsion to analytics in the first place. The shot went in, so it must have been a good attempt that was never going to miss. This shot.
Now, the original poster (RSPCT Basketball) has posted once in the last four years, and Emerson Brown is no longer active at that account handle. Things change. I do think we’ve made major progress in how analytics are discussed, handled, and dealt with basically everywhere. At the time that shot occurred, Nate Oats had just left Buffalo for Alabama and no one outside of Division 2 fans had heard of Josh Schertz or Ben McCollum.
Still, the post makes me think so often about probability. Partially because when I went to the Henry Ford Museum with my wife in the offseason I saw Mathematica for the first time, but moreso our inability to take probability on a shot-by-shot basis. Think of it this way: when Reyne Smith, national leader in made threes among high-major teams (68 made shots, 38.6% 3PT), attempts this shot:
Your guess when it’s released is “oh, that’s probably going in.” Smith is a 39.1% 3PT% shooter on catch-and-shoots this year and 47.4% on open ones, which this one is. This shot does not go in.
Here is the exact same action against a superior defense in Virginia. It is reasonably, although not perfectly, guarded. It produces the exact same shot in the exact some spot of the court with the exact same amount of seconds left on the shot clock. This shot goes in.
By either metric you choose - 39.1% or 47.4% - a miss is more likely to happen than a make when Smith attempts this shot. It does not feel that way to us in real time, because our brains take the binary as presented by Mr. Brown: if it is a good shot by a good shooter, it deserves to go in. The ball never lies, except it does every single game with pretty high frequency.
Even by the second number of 47.4%, that’s basically ten flips of the coin. It is most likely that this coin will come up with a YES (in our scenario) five times out of ten, but it could also be seven out of ten or three out of ten. It could also mean Smith makes this shot four times in a row, but proceeds to miss five of the next six despite doing nothing functionally different. He still makes 50% of his shots, but we think of him as being in a mini-slump because he’s 1 for his last 6 from deep.
I have thought about this a lot lately because of two very similar basketball teams experiencing extremely different outcomes to the 2024-25 season: the Florida Gators and the UConn Huskies. Both teams have top-10 offenses, are excellent on the boards, don’t generate (or give away) many turnovers, are top-20 in opponent 2PT%, and have low defensive Assist Rates and Three-Point Attempt Rates. Both are led by analytically-friendly coaches that play modern basketball.
And yet: one is 15th in defensive efficiency. The other is 128th. In a make-or-miss sport, one team is running tremendously hot on the probability front. The other is experiencing the worst shooting luck of any decent basketball team this year. Why? How? Well, here’s an attempt to answer and to show what ends up happening to teams like Florida and UConn that are good at basketball but experience unusually hot or cold runs of play defensively.
BEHIND THE WALL ($): The Regression Monster lurks


