A couple weeks back I wrote about how this season was trending towards one of the wildest NCAA Tournaments on record. There’s not nearly as large of a gap between the top-end and middle-end of the sport as usual. The back quarter of the ‘real’ field - i.e., seed lines 10 through 12 - is actually stronger than average, while the teams tracking to be 2-4 seeds are the worst in years.
What does all of this mean? Possibly nothing, but based on previous seasons, it certainly seems like we’re headed in the direction of a memorable March that leaves a lot of people unhappy. Just like every March, but even more painful!
As promised many times over, here’s your February 1 (on January 31, because of blog scheduling) update on where the prospective Tournament field stands, at least by the standards of the KenPom Top 50. (I’m using the top 50 because, including the four play-in at-larges, that’s how many teams constitute the top 12 seed lines. Also: nice round number.)
The good news for research purposes: Ken’s site has ratings on February 1 of a given year for every year dating back to 1998. That’s both amazing and incredibly useful for seeing how things are at this particular point of the season compared to seasons past.
This is an unusually vulnerable top five
Initially, I hesitated on saying this because, at the moment, both Tennessee and Houston have a near three-point lead in Adjusted Efficiency Margin on the rest of the field. That in itself is a good thing for those two, and over the last 25 seasons, their average 3.55-point gap on teams three through five is below average but not a disaster. It’s 18th-best. Still: it’s really, really weak.
As of today, the average AdjEM for the top five is +27.31; that’s the third-lowest of the last 25 years, barely ahead of 2003 and 2016.
If you have some memory of previous seasons, you’ll notice some very calm tournaments - 2015, 2019, 1999 - at the very top. Generally, the better the top-end of basketball is, the less upset-heavy the Tournament is going to be. Meanwhile, at the bottom of the pile - those four years within a point of 2023 in either direction - we’ve seen, in order, a 1 seed, 3 seed, 7 seed, and 2 seed win it all. Considering that a 1 seed has won the title in 16 of the last 22 Tournaments, that’s not ideal, unless you like chaos.
The other aspect of this are the teams themselves. Tennessee is just the second #1 team in this 25-season data set to fail to crack a +30 AdjEM on February 1 (2016 Oklahoma). Houston is less extreme, but they’re still two full points below average. Even teams three through five - UCLA, Purdue, Alabama - rate as the weakest top 5 three-piece the college basketball field has produced since 2003. Of course, in 2003, all the 1 seeds at least made the Elite Eight, so it may end up meaningless.
This is an extremely unusually weak top ten
If that last graphic bummed you out, maybe skip this one.
In the KenPom database, this is the lowest-rated top ten in modern basketball history. It’s worth noting that the top five itself, while weaker than the norm, is not really the problem here. It’s the teams ranked 6-10, which rate as the second-worst batch in our 25-season data set, only topped by 2006.
Luckily for 2023, now that we’ve added data beyond the 2011 season, we’re now able to say that only 5th-place Alabama and 7th-place Saint Mary’s are the actual Weakest Of All Time at their respective positions. Now, if you’re looking for a post-2006 world, AKA the weakest teams at their positions from 2007 onwards:
Then it probably gives you a more accurate reading of the situation. Tennessee and Houston are obviously weaker than your traditional #1 and #2, but it’s the back end of the top 10 that really struggles to measure up.
The rest of the top 25 is below average, but not by as severe a margin
Basically: whereas the 2023 top 5 ranks 23rd of 25 seasons and teams 6-10 are dead last, the rest of the top 25 - teams 11-25 - rank 20th in our data set, and it gets particularly better the further you go. Here’s an updated graph from last time out that shows the gap from 2023 to the average AdjEM at that spot from 1998-2022.
Two things I think you’ll notice immediately:
2023’s consistently below the national average by a point or more from positions 1-18. Then, starting around 19th on back, it levels out. 25th is the first position in this entire graphic that isn’t one of the 10 worst in our data set.
While an imperfect measurement, the gap from an average 11th-18th placed-team to the average 19th-25th placed-one is the smallest since 2004. To boot: the gap from 11th to 25th, at the time of writing, is just 3.42 points worth of AdjEM, which is the second-smallest gap ever (2008). It makes sense that a crappy high end, if there’s a small gap to the back end, would mean it gets better the deeper you go.
Which naturally leads us to
The back half of the field is actually pretty good!
When I posted the initial article, newly-minted Trusted Agent Andrew Weatherman shared this observation:


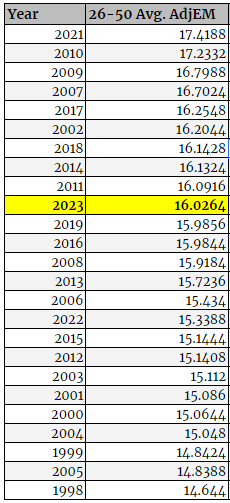
Andrew is correct. I’d argue this is on pace to be the most parity-filled field in modern Tournament history for a few reasons. The first is that, yes, teams ranked 26-50 are actually better than what we’ve come to expect:
But far more importantly, this is the smallest gap we’ve ever seen before since analytics sites have existed from the top to the bottom. Bernie Sanders would adore this graphic.
The gap between the top 10 teams and the bottom 10 teams in KenPom’s current top 50 is all of 10.374 points, the smallest gap ever recorded at the start of February of a given season. The only two seasons that come within serious shouting distance - i.e., a point - are 2010, a year in which two 5 seeds made the Final Four, and 2002, a year where a 12 and a 10 seed made the Elite Eight.
To go further, though, this really is a pretty strong back-end group. Teams 41-50 offer an average AdjEM of +14.9, which is the seventh-strongest on record and, if not for 2018 being all of a hundredth of a point ahead, would be the second-strongest we’ve seen since 2010. When the four tournaments closest to yours in 41-50 quality saw the 10-12 seeds garner nine combined Sweet Sixteen bids (the average here is more like seven), you’re looking at a fun first weekend.
The closest tournament in top-to-bottom gap is that 2010 one, which saw five of the top 12 teams head home by the end of the first weekend and offered a Sweet Sixteen with a 9, 10, 11, and 12 seed. Similarly, that field got better and stronger the deeper you went, offering the second-strongest back ten teams ever behind 2021.
What does all of this mean?
Very little, it’s January 31.
To be honest, this really could end up all being meaningless, and the 2023 season + Tournament could be one of the biggest outliers of all time: a parity-filled season that ended with no huge upsets. But that seems like a less likely projection day after day, so who knows.
Any other notes?
Well, of course.
The gap from 1-10 to 26-50, at 11.29 AdjEM, is the second-smallest ever behind 2016.
The gap from 11-25 to 26-50, at 3.61 AdjEM, is the second-smallest ever behind 2002.
The gap from #1 Tennessee to #50 (at the time of writing) Virginia Tech, a margin of +15.09, is the second-smallest ever behind 2016.
Just five efficiency points - aka, a roughly 3.5-point gap in a real game - separates 8th and 28th, i.e. a 2 vs. 7 second-round matchup. The average gap there is more like a 5-point gap in a real game.
Every team from 1st to 26th is below the historical average. Conversely, 18 of the remaining 24 teams, including everyone from 39th on back, is above the historical average.
Also, here’s a graphic showing this year’s field versus the historical minimum/maximum rating at that given position.
Are there any obvious historical comparisons?
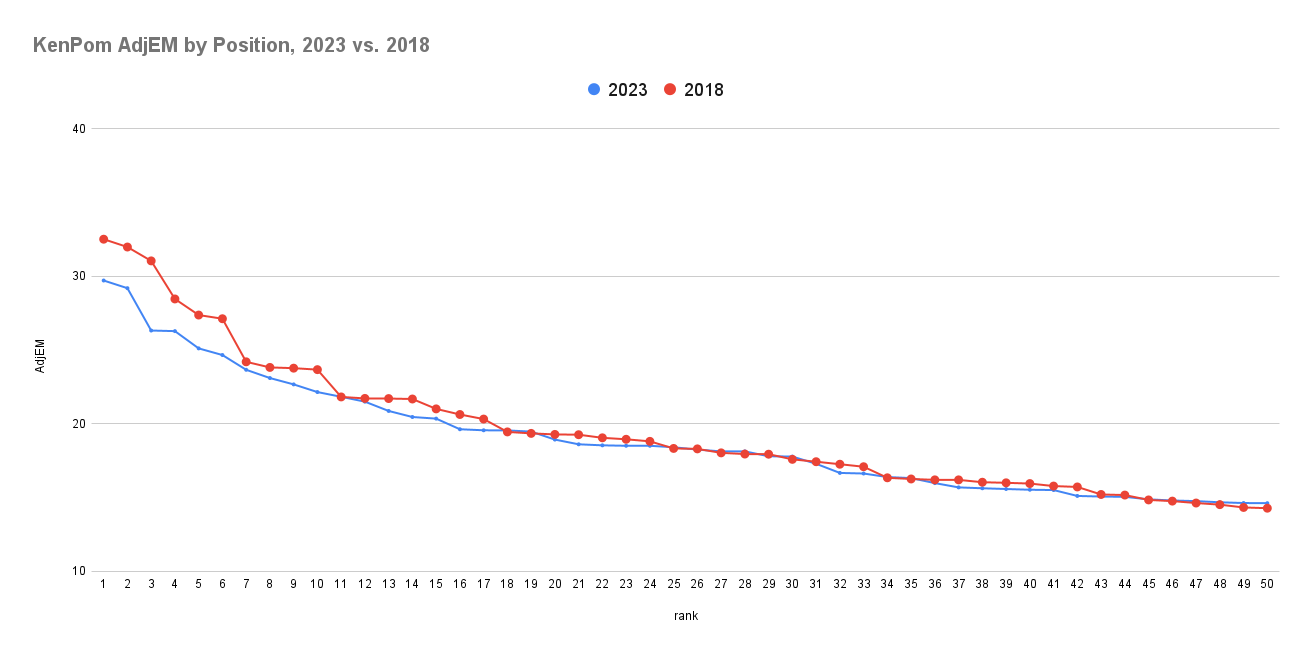
Calculating cosine similarity is nerd stuff, which is what I do, but I didn’t entirely agree with the selections here. It tells me the most similar tournaments are 2016 (passes the sniff test), 2019 (?), and 2018. The field was a lot stronger from 5-25 or so in 2016 than it is now; 2019 I do not get at all; 2018 at least looks pretty similar point-for-point especially from 10th on back.
The ones that look most similar point-to-point are probably 2018, 2006:
Or maybe 2002:
All of which were pretty chaotic Tournaments. We have another month-plus to go until the bracket’s actually made, though, so we’ll see if it actually lives up to the hype. For now, though, it seems like 2023 could be another manic March.


