


Yes, the 2025 NCAA Tournament is still tracking to be historically strong...with some caveats
Hope you hate upsets and love dominance

It’s post-Super Bowl week, so the eyes are back upon the sport of college basketball once again. Naturally, this leads the new viewers to a few different questions, none of which will be answered by me:
Who are the teams I should care about?
Who’s going to win the title?
What mid-major is going to force me to holler about my bracket being busted?
Is Duke going to win it all?
Are these teams even good?
Is the bubble as bad as people say?
In order: all of them, somebody, Drake, maybe, yes, no. There’s your summary of the college basketball season! I hope you enjoyed.
In lieu of playing to the crowd, I wanted to offer an update on something I wrote about a while back: how the 2025 NCAA Tournament field, at large, was shaking out. In the middle of January, we were tracking for the strongest field on record with a historically strong top-end, two things that generally portend less upset-heavy NCAA Tournaments across history.

At the time, these were the things I noticed and began tracking in the data:
We were on track for the strongest field in modern history at the time by average Net Rating, dating back through 2012.
Using look-ahead data for February and onward, we were on track for the strongest field in at least 30 years.
The strongest top 5, second-strongest top 10, and strongest top 25 on record at the time all came from 2024-25.
The gap from top (1-5) to bottom (26-50) was the largest since 2019 and significantly larger than any of the last four Tournaments.
Now, when I ran the data then, the correlation equations I ran produced three Tournaments as this year’s most similar forebearers: 2007, 2017, and 2019. Each had some amount of similarities: Final Fours mostly made up of 1 and 2 seeds, Tournaments relatively light on upsets, and a total of two 10+ seeds that made the Sweet Sixteen (the Tournament averages 2.2 per year).
This news hasn’t stopped the usual hordes of people, some of whom I genuinely like, doing the Please Like My Sport thing. Run a search and you’ll find “it’s really wide open this year”, “the college basketball field is as wide open as it’s ever been”, and my favorite, “all 364 teams have weaknesses” (this one is objectively correct). It isn’t really beneficial to the bottom line as a content creator - a phrase I despise, but is kind of what I do - to say things won’t turn out to be the most interesting possible outcome.
A month later, the data mostly holds up. There are some minor changes, but this time, I’ve included more historical context, extra info, and yes, a projected bracket (conference tournament goofiness included) that showcases a potential Selection Sunday reveal of a field that might be low on upsets but extraordinarily high on potential quality matchups. Okay, maybe that last one is me doing the “everything is good” thing.
BEHIND THE WALL ($): More songs about Tournament stats and food
Let’s get the headlining stuff out of the way first: yes, it’s still a hell of a year for college basketball no matter where you look.

Based on historical data from February 14 of every year from 1998 to present, this is the best top 50 on record. It’s the best at every single quadrant. Now, this is a bit suspicious to take at face value. It can’t all be that good, can it? So I extended it: what about 51-100? Well, those results were fairly fascinating, too.

Even the aft end of the top 100 is killing it, with only 2021 and 2010 in striking distance. What could all of this mean? Friend of the Substack
has a theory he sent over. (Even if you are not of the Purdue coalition, I recommend following Connor wherever he exists.)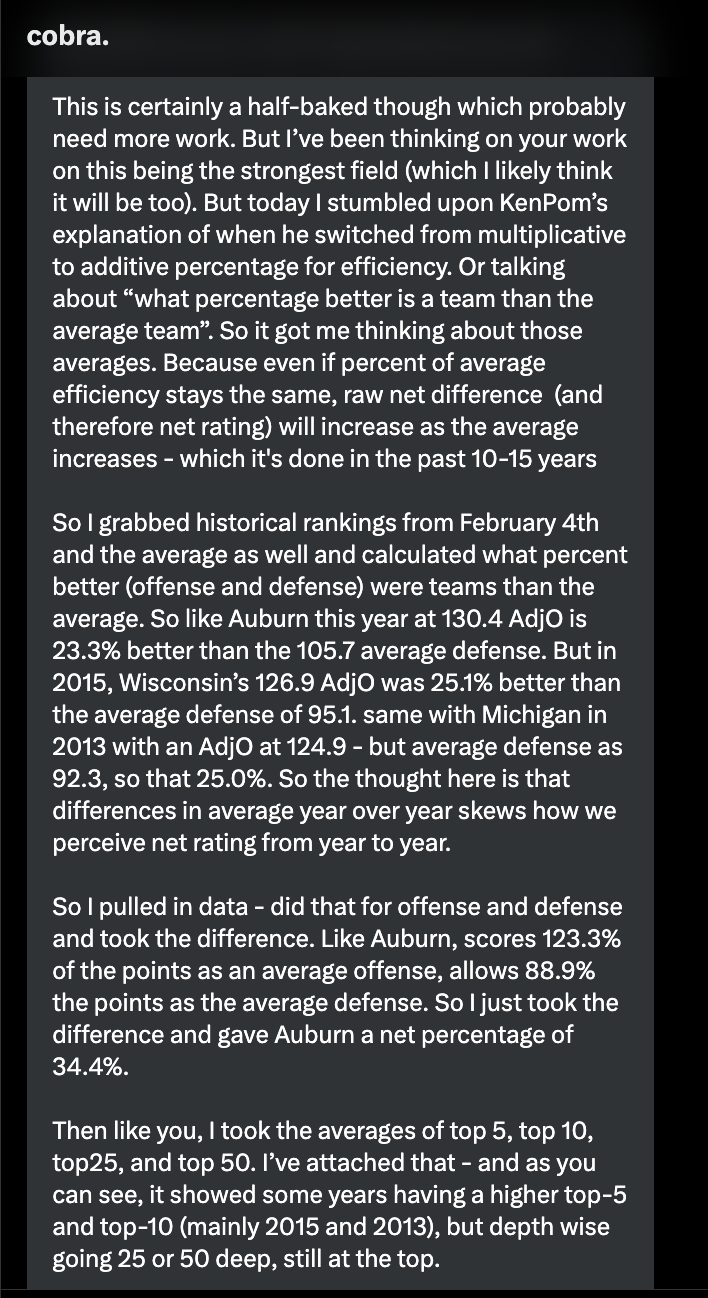
Connor’s work produced the following info as of Wednesday: a really good top five that’s not as good as 2013 or 2015, a strong top 10 that’s not as strong as 2013, 2015, or 2019, but historically strong top 25 and top 50 groupings that haven’t been matched in modern college basketball history.

Basically, this implies that while 2025 is still unusually strong across the board and has the largest gap between the top 5 and top 50 since 2019, it’s not something we haven’t seen before. In fact, you could argue that based on this, the top-end talent we saw in 2013 and 2015 was a little stronger. Those years had 1 seeds that won it all, but they still had some weird happenings, such as 15 seed FGCU making a Sweet Sixteen.
Now, this is still a really strong year for college basketball, but Connor’s work (which we both want to test further in the offseason) implies that this year’s Net Ratings could be a little inflated based on historically high offensive efficiency and a system that perhaps hasn’t fully grappled with the implications that brings just yet. Testing this against Bart Torvik’s mid-February numbers from 2008 to present (which uses some aspects of the older KenPom Pythagorean formula), it produces similar results.

So, the actual answer may be this: while we are in the midst of one of the strongest seasons in many years, it might not be quite as historical as I once thought. It’s probably just a really, really good college basketball season all over the place. Cross-year comparisons can always be frisky, but I do think it means something that a team like 2022-23 Purdue - +25.80 NetRtg, 4th overall, and a future 1 seed - would currently rank 12th and well outside the 1-seed picture in 2025.
Likewise, it may be extra meaningful if you’re just pretty good (+20 NetRtg) as opposed to really freakin’ good (+30 NetRtg). Think of a team like Michigan, who is currently 19-5 with a NetRtg of +23.57. In 2022-23, Michigan would’ve ranked 8th-highest; with their Torvik rating of 0.924, they would’ve ranked 9th. Instead, they’re 24th and 19th at each site, respectively. Such is the misfortune of merely being pretty good this season.
So: what does 2025 now compare best to? The same examples as before hold up, after combining Torvik’s data with Ken’s, we have some new Tournaments to look to as our closest modern comparisons.
2017. This one ended up rising in the data as the strongest year-to-year comparison for 2025. 2017 had the following: a very strong top 10, the third-strongest field in general, but also had a similar strong dropoff from the top 50 to the teams ranked 51-100, as well as being one of just two years on record (2000 being the other) with a stronger dropoff from 11-25 to 26-50 as 2025 has. In terms of pure correlation score, the gap from #1 2017 to #4 is the same as #4 to #21. It’s very, very strong. Worth noting some good and some bad: we had a national title game of 1 vs. 1, but we also had a 7 and an 11 in the Elite Eight.
2009. This is second-strongest and is probably the most unfortunate possible case for a Tournament, outside of 2007. Very similar stuff existed here: strong overall field, large dropoff from #50 to #100, but with a significantly weak top 5 and 10 compared to 2025. Second-strongest field in the Torvik era behind 2025. I was alive and well for this Tournament and the only things I can remember are Michigan State making the title game and Villanova beating Pitt in the Elite Eight. Really, really dull Tournament.
2008. For the same reasons as the above two, but this is where the correlations drop off a bit. There’s the same large gap from top to bottom as exists now, but the top end wasn’t nearly as strong as this year appears to be. Still, it had the same sensations as 2025: really strong top two or three teams, abnormally highly-rated team with meh offense and elite defense (Memphis then, Tennessee now), and had a similarly ‘flat’ top 25 as today.
BONUS! 2014. Now, let me note this: 2014 is closer to correlating to 22nd overall than it is any of the top three. But it wouldn’t be fair to give you just these top three and not inform you of what ended up fourth, and what makes cross-year comparisons less easy than you’d hope. 2014 of course was the nuttiest tournament in history, and per Torvik, it had the second-weakest top five of the last 18 years behind 2016. (Another forgotten nutty Tournament.) But! It did exhibit some minor similarities to today: an unusually strong top 25, a large gap from 25th to 50th, and a top 100 that got weaker the deeper you went.
The problem with this is our other BONUS!, which is 2007, the exact polar opposite of 2014. I’d just pay attention to the top three, as they really separated themselves from the pack in terms of correlation scores.
So, take those top three. What do you get? Well, you get three pretty top-heavy Tournaments. Among 2008, 2009, and 2017:
Average of 4.7 Round of 64 upsets (average of other 21 Tournaments, 2000-pres.: 5.1)
Average of 1.7 10+ seeds in the Sweet Sixteen (other 21 Tournaments: 2.24)
11 of 12 1 seeds made Elite Eight (expected number: 7.5)
8 of 12 1 seeds made Final Four (expected number: 4.4)
Not ideal for those of us who do like a little bit of chaos, frankly. Still, each Tournament is its own unique beast, and perhaps I’ve got it all wrong this year. The Selection Committee knows how to zig when others zag, and maybe they’ll accidentally generate more upsets than we’re anticipating.
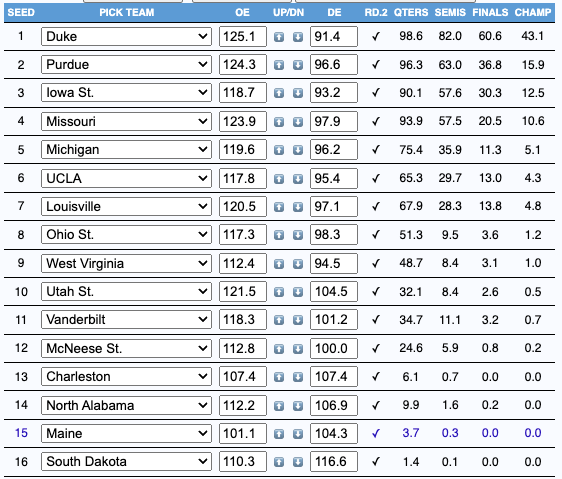
The last remaining question: how does all of this look in practice? Using Torvik’s TourneyCast tool, I simulated every conference tournament (upsets included!) and generated our first fake bracket of the year. (I didn’t bother with simulating out the First Four, sorry. It’s just whatever team rated higher.) Here’s who made the field and where:

Here’s the odds for your four regions, with some minor analysis after.
South Region (Atlanta)

East Region (Newark)
Midwest Region (Indianapolis)

West Region (San Francisco)

Based on our very simplistic tournament simulation, we’d expect the Final Four to be represented of (on average) two 1 seeds, one 2-3 seed, and then something beyond that. The champion would be unusually likely to be a 1 seed. We’d be in trouble of a very drama-free Round of 64, short of perhaps a 13 seed over a 4 and your usual two 12-over-5s. The expectation would be around 1.4 or 1.5 double digit seeds in the Sweet Sixteen. This isn’t really the chaos we generally see on most Selection Sundays!
Of course, there’s an entire month to change this, and it won’t look like this on Selection Sunday. But with three-plus months of data in hand and a fake bracket to look at, the most likely scenario is us staring down one of the less upset-heavy Tournaments we’ve seen in 20 years.
I think among the projected regions, the West has the best chance to be a little squirrel-ly
Yale over Kentucky...... lets go