NCAA Weekly, Vol. 12.3: Yes, we're still tracking for a wild March
three weeks out from Selection Sunday, one last update
I did not aim for the goal of this Substack to be the March Madness Parity Beat, but, well, I guess we are here now. Twice now (once in mid-January, once at the start of February) I’ve written about how this is statistically pointing towards one of the more chaotic NCAA Tournaments we’ll have seen in modern history.
I suppose I’m pleased to share that, in our last update before Selection Sunday (the next will be post-bracket reveal), this is still pretty likely to be a wild tournament. However, the latest data dump of previous February 17s showcases an unusual trend in the 2023 field: the gap between the top and the bottom is actually growing ever so slightly.
As a reminder, Ken Pomeroy’s site has ratings on February 1 of a given year for every year dating back to 1998. I’m using the top 50 because that’s the same amount of teams that generally constitute the top 12 seed lines. This is obviously far from perfect because they don’t seed the bracket by KenPom rating, but considering the average 11 seed ranks around 43rd or so with the average 12 seed about 53rd, it’s pretty functional. The real drop-off is in the 13-16 seeds.
The first half of this is updates from last time; the second half is new observations.
The top five has gotten marginally worse
This is what you’d call a not-great trend for the top contenders.
While 2023 has managed to erase its previous sins as featuring some of the weakest teams in the 6-25 range in tournament history, it now has the lowest-rated #2 team of all time in Alabama, who sat at +27.11 AdjEM at the time of writing. The good news for Alabama fans is that the previous worst #2 team on February 17 of its given year was 2015-16 Villanova at +27.39, who went on to win the whole thing.
Still, this above chart does a good job of visualizing just how far down the top chunk of teams - Houston, Alabama, UCLA, Tennessee, and Purdue - are compared to what we’d normally expect. This is now the second lowest-rated top-five group in Ken’s 25-year database, and none of its four closest comparisons saw a 1 seed win it all.
The only year worse is 2016, which did see a significantly better top group emerge by Selection Sunday. Still, this seems like an educational year to focus on. All of the top five were 1 or 2 seeds, but #1 Michigan State would lose to a 15 seed in the Round of 64, while #3 Virginia made the Elite Eight only to lose to a 10 seed Syracuse. The year just ahead - 2003 - saw one of its top five teams make the Final Four. Even 2014, a relatively mild year by comparison, saw its #2 and #4 teams head home in the first weekend. Those are the type of things you’re generally looking for: one or two teams breaks free and gets home, but the others fail to live up to expectations.
Final Four seeds for years noted in parentheses: 2003 (1, 2, 3, 3); 2014 (1, 2, 7, 8); 2016 (1, 2, 2, 10)
This is still an extremely weak top ten
Oh dear.
Yes, this is still the worst group of top ten teams in at least 25 years of the NCAA Tournament. If Ken had data back to the start of the 64-team field, it wouldn’t surprise me to see it still rank out as the very worst, at least one of the bottom three. Whereas last time it was more the 6-10 teams that ranked out horrifically, there’s less of a gap this time. Separate from each other, 1-5 and 6-10 both rank 24th-best all-time. The only difference is the top five teams being saved from dead last by 2016, while 6-10 are saved from the bottom by 2006.
If 2006 ends up being a comparison here, it could be reasonably educational. That tournament saw zero 1 seeds crack the Final Four for the first time in the history of the 64-team field. (It’s only happened one other time since, 2011.) That year, just one of KenPom’s top 10 teams on February 17 ended up in the Final Four. Four of the top ten at least made the Elite Eight, though, so hey! (Probably of note: this tournament saw half of the 2/3 seeds go home before the Sweet Sixteen.)
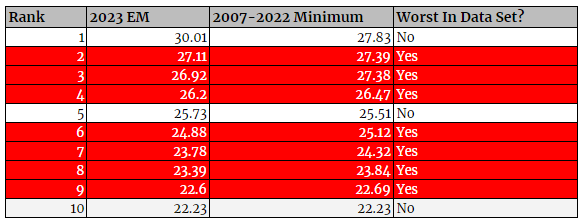
If you’d like an even rosier look at the situation, considering that 2006 saves this group from a lot of all-time minimums, here’s a list of the top ten and if their current rating is the worst measured from 2007 to 2022 at their given spot. The answer, very likely, is yes.
Considering that #5 and #10 are saved from being the worst at their ranks by 0.22 points and a dead heat, respectively, I think you get the gist. And this is despite the 6-10 teams actually improving a little on the whole the last two weeks!
Final Four seeds for years noted in parentheses: 2006 (2, 3, 4, 11)
Luckily, 11-25 is down bad, too…but it gets better the deeper you go
Please note that the below is for teams ranked 11-25, not the entire top 25 as a whole.
Yes, I’m reaching. Clearly. But if you were this mired in the depths of suck, you’d reach, too.
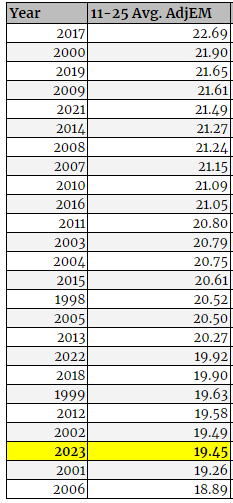
Similar to our above charts, here’s how it looks for the back 60% of the top 25. Is this still kinda rough? Yes. Is it not dead last or next-to-last? Also yes! It’s merely the third-worst 11-25 grouping ever.
Positivity! Love! Peace! Joy! The 11-25 teams are interesting because, generally, that’s where you’re finding most of your 3-6 seeds. You can generally expect 1-2 3 seeds to be ranked in the top 10 of KenPom in a given year, but most of them will be in this grouping. The 6 seeds are similar: more often than not, they’re in the back end of the top 25.
Let’s take a look at the three years closest, ones we haven’t covered yet: 2001, 2002, and 2012. While this will require more context later on with the 26-50 group, I think it’s interesting to see how the 3-6 seeds collectively performed in those three NCAA Tournaments, specifically. So: how’d they do?
2001
3 seeds: 1 Final Four, 1 Sweet Sixteen, 2 Round of 32
4 seeds: 2 Sweet Sixteen, 2 Round of 64
5 seeds: 1 Sweet Sixteen, 1 Round of 32, 2 Round of 64
6 seeds: 1 Elite Eight, 1 Round of 32, 2 Round of 64
2002
3 seeds: 2 Sweet Sixteen, 2 Round of 32
4 seeds: 2 Sweet Sixteen, 1 Round of 32, 1 Round of 64
5 seeds: 1 national runner-up, 3 Round of 64
6 seeds: 1 Sweet Sixteen, 1 Round of 32, 2 Round of 64
2012
3 seeds: 1 Elite Eight, 1 Sweet Sixteen, 2 Round of 32
4 seeds: 1 Final Four, 2 Sweet Sixteen, 1 Round of 64
5 seeds: 2 Round of 32, 2 Round of 64
6 seeds: 1 Sweet Sixteen, 1 Round of 32, 2 Round of 64
I’d argue that this is very mildly informative if at all, but it produces some interesting notes. 3 seeds went home in the Round of 32 half the time, more often than expected. 4 seeds managed more success, but 5 seeds were a disaster, going 5-7 in the Round of 64 (all other years: WP% of 63%). 6 seeds, meanwhile, barely got to the Round of 32 half the time and had just three teams make the Sweet Sixteen.
What does this mean? Nothing, probably. But it feeds nicely into the next segment, which is about
The teams ranked 26-50 are better than average, and the field gets stronger the deeper you go
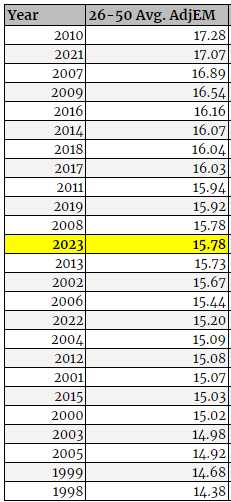
And, because we’re pals here, I’ve got a couple of graphs that outline this for you. Graph #1 is purely the average AdjEM of the teams ranked 26-50 versus those from the last 25 years, which looks quite favorable:
And here’s how it breaks down, both from 26-40 and from 41-50:
That’s the kind of field we’ve got right now: very weak at the top, relatively weak and mushy in the middle, but the second you get to, like, 7 seeds and greater, the stronger this field becomes. By the time you get to #40 - currently occupied by Duke, of course - the remainder of the top 50 is stronger than its historical average.
If you take the field as a whole, just like we did last time out, what you’ve got is one of the two most parity-filled top 50s seen in 25 years.
The gap has widened a bit since the last time we did this, when it was a 10.37 point gap from the average top 10 team to the average 41st-50th ranked one. Still, 2023 has pretty firmly locked itself in as one of the four least top-heavy tournaments in modern history, barring a serious surge over these final three weeks. Its counterparts - 2006, 2010, and 2016 - featured a grand total of two 1 seeds in the Final Four.
Considering there’s only so many games to go - most have a maximum of, like, nine - this is shaping up to be quite the tournament on paper. You’ll note that the ones at the bottom of this list felt much tamer in comparison. While 2008, a year where all 1 seeds made the Final Four, is around the middle of the pack, the four tournaments at the bottom saw nine 1 seeds make the Final Four, with just one sub-5 seed getting in (2015 Michigan State).
These four Tournaments also saw an average of just 4.25 Round of 64 upsets (6 vs. 11 or greater); the average tournament produces 5.22. The four closest to 2023, meanwhile, saw an average of 6.25 first-round upsets, including seven (!) 3 and 4 seeds going down in the Round of 64. (All other years have seen an average of about one per year.)
Now, for the new observations.
This is one of the most offense-averse top fives ever…with one of the deepest offensive fields in history
The average top five team this year rates out as having roughly the 17th-best offense in the sport, which works because they’ve collectively got about the third-best defense. The top four teams all have top-six defenses, but just one (Houston) has an offense within the top 15.
This is actually pretty unusual. 2023’s top five offensive efficiency averages out at 116.74 AdjO, which is the fourth-lowest on February 17 of a given year and is the worst we’ve seen since 2012. What’s stranger is that the back half of the top ten actually has great offenses, posting an average 117.72 AdjO that’s fifth-best all-time. To go with that, the teams ranked 26-50 are fourth-best. I don’t know that it means a whole lot, but to see that wide of a split between your top five teams and the rest of the field doesn’t happen often.
The years most similar to 2023 featured not just weird Final Fours, but really nuts tournaments, period
This is going to involve a couple different observations, but we’ll start with scanning the year-over-year charts for rank-by-rank similarity. Immediately, if you use the data, you’ll notice that 2023 and 2002 are pretty tight after the top two teams:
That 2023 and 2006 are pretty well-tied to each other throughout:
And that 2023 and 2018 are surprisingly very tight with one another after the top few spots.
So let’s break down the commonalities here, one by one.
2002, 2006, and 2018 all featured at least one 5 seed or lower making the Final Four. I imagine this won’t be a surprise, obviously, given that roughly one 5 seed or lower makes it on average every year.
All three featured at least one 9+ seed in the Elite Eight. Again, happens more often than not. However, the volume in which it happened in these three tournaments was unusual: six of the 24 Elite Eight participants were seeded 9 or higher, including one of two 12 seeds to ever make an Elite Eight in Missouri.
These three NCAATs are responsible for three (!) of the 15 1-seed losses in or before the Round of 32 since 2000. Considering it happens about once every other year otherwise, that’s of interest.
Also: upsets aplenty. The average NCAA Tournament, since the expansion to 64 teams, has offered 4.7 Round of 64 upsets (11 over 6 or greater) and 2.8 in the Round of 32. These gave viewers an average of 5.7 in the Round of 64 and 4.3 in the Round of 32 for an overall first-weekend average of 10 (!) upsets. That’s a pretty insane hit rate of an upset every fifth game, roughly.
Also also: the future national champion was not #1 in KenPom on February 17 of that year. 5th, 5th, and 2nd from oldest to newest. In fact, the #1 KenPom team (Duke, Duke, Virginia) all went out before the Elite Eight. Watch out, Houston.
However, let’s look into the other tournaments that graded out as at least fairly similar to 2023, whether by approximation in the previous charts or something that simply popped off the page.
2016 came very close to being the fourth example; it matches quite well with 2023 at the 1-6 and the 25-50 spots. However, the back half of the top 25 is quite a bit stronger than 2023’s. Either way, you remember 2016 as the year with the most-ever first round upsets (8). What you probably don’t remember is that the rest of the NCAAT was pretty calm, producing a 1 seed and two 2 seeds in the Final Four. Oh, and probably the best title game ever.
2010 is the only Tournament with a smaller gap between the top 10 and the bottom 10, and it certainly felt like it when it went down: two 5 seeds in the Final Four, 3 10+ seeds in the Sweet Sixteen, and the overall 1 seed losing to a 9 seed. However, 2010’s 26-50 teams are the strongest on record. This could still happen this year, of course, but it would take either a collective uprising or a serious shrinking by the top 10 to make it happen.
Lastly, 2003 was just sort of crappy on the whole: 23rd-best top 5, 24th-best top 10, 22nd-best 26-50 teams. But the back half of the top 25 was unusually good, which is probably why a team from the back half of the top 25 won it all. No team seeded lower than a 3 made the Final Four, and this was a fairly calm tournament on the whole before the Final Four.
We’ll see what more we can learn on Selection Sunday, as there’s a lot more data to come. If anything, I think we know that the likeliest outcome is one of the more wide-open Tournaments in recent memory, though we also know it probably results in a 1 seed winning it all like usual. Just don’t be shocked when that 1 seed shares the Final Four with, say, a 2 seed, a 4 seed, and an 8 seed.


Sounds like we're in for a wild ride. Couple of things:
1) Hope your Tennessee writing sabbatical has gone well. I'm sure Wednesday night helped. Are we close to getting Show Me My Opponent back?
2) In one of your recent columns you posted a link to something you wrote back in 2020 about the fallacy of the media's obsession with “Every champion other than 2014 Connecticut in the KenPom era has ranked in the top 20 of offensive and defensive efficiency.”
You ended that column with some statistical observations I was wondering if you could update:
- In the KenPom era, 15 of 18 champions ranked in the top six nationally prior to the Tournament beginning.
- Seven of the last eight champions have had at least one side of the ball rank in the top seven nationally.
- 17 of the 18 champions in the KenPom era, other than 2014 Connecticut, had both a top 40 offensive and defensive efficiency.
- The #1 overall KenPom team has won the Tournament only three times in 18 years.